Humans are naturally visual creatures. Some of us are visual learners, meaning, we learn by seeing things in action. Tracing is seeing things in action. Troubleshooting where and why something is slow or flat out broken, with clear visual indication, is incredibly powerful. Visualizing an entire path of transactions with the ability to correlate the internal calls and the calls between external services, while calculating the time they took and understanding the time they should have taken, yields a piece of vital information to understand the root cause of an issue.
Tracing isn’t a new and wondrous technique in the world of technology. Well known in the world of computer science is the term inter-process communication (IPC): the mechanisms an operating system provides to allow processes to manage shared data. Many of us are more familiar with the term client-server. Clients and servers can use IPC to request information and respond to requests and provide information. Capturing information like the requests and responses of IPC and using it to better understand your applications is a brilliant form of tracing.
An example of a widely known and used inter-process communication is gRPC (gRPC Remote Procedure Call) which uses http/2. gRPC was initially developed at Google in 2015 and announced as an open-source remote procedure call shortly after. Because it generates cross-platform client and server bindings for many languages, it’s become common usage in connecting services in microservices architectures and meets many of the goals set out by the Cloud Native Computing Foundation (CNCF).
A common practice today is to visualize the communication of systems and applications by adding a trace ID to each request at your gateway, which will then be subsequently added to the logs of each service. Once the logs are collected, processed, and stored, you can then run queries and use visualization tools to connect the log event trace IDs to visualize the path. As a visual creature, you want to see the IPC, as well as external communication for total end-to-end visibility. But you also want to understand more than whether a request has failed or been successful. You want to understand if the request and response time is normal and if it took the intended path.
So let’s apply AIOps to drive much more value and automation to your distributed tracing.
Method I
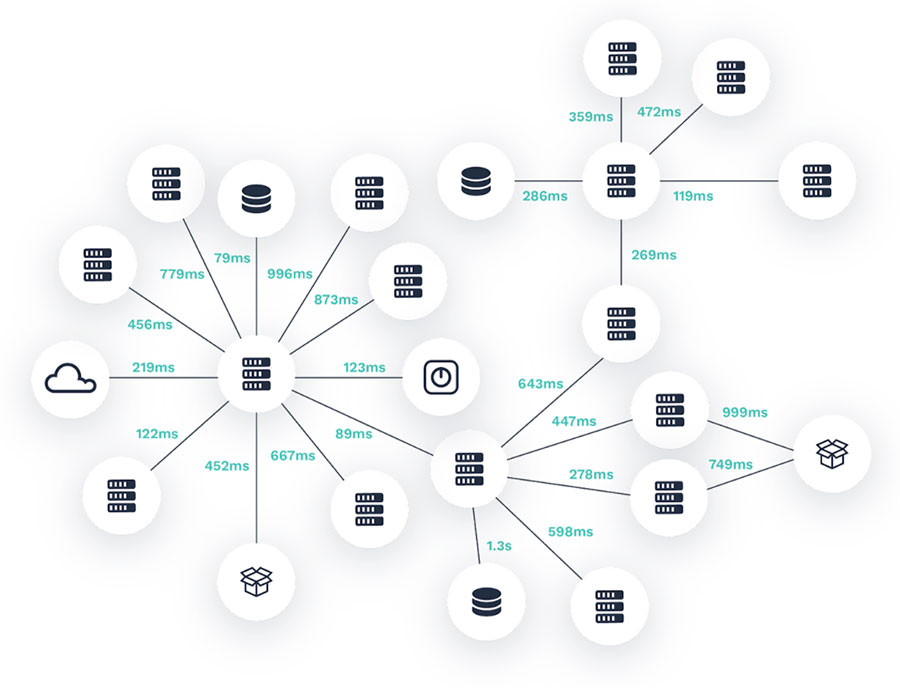
Processes and services can communicate using pipes and internet sockets. Regardless if it’s a container running as a sidecar, embedded in a Kubernetes cluster, running on a standalone node, you can easily see and collect the communication. There will be short-term sockets (connections) and long term sockets? (e.g.: open connections to a database).
Understanding the protocol of these connections allows AIOps to examine the packets to view the headers and get a better understanding of the criticality and dependency. Constantly testing the critical paths from node A to any dependencies, to accurately detect if a distributed application is failing, due to an external dependency, can then begin to build out the topological connections. Furthermore, by measuring the latency and turning the number of failures over time into an availability percentage, users can be made aware of the most commonly failing dependencies. This is where the time-series element of tracing really begins.
When leveraging multiple collectors running in your environment, you can also begin to understand external communication to and from each collector, not to mention the communication the collector is reporting back to your Moogsoft instance. Each collector can assess the communication and latency between one another to determine when the latency is out of the normal and expected range. When it is out of the expected range, an anomaly would be generated and follow the stream of anomalies through the layers of multivariate analysis discussed in the previous blog covering metrics.
Method I is considered network tracing and path availability. While this isn’t exactly tracing your application, it is important to understand any latency to start to build out a topology you can visualize. This information is critical to improving the performance and availability of modern complex distributed systems.

Building connections and topologies from discovered information
Method II
Here’s a common approach to tracing today, but with a twist.
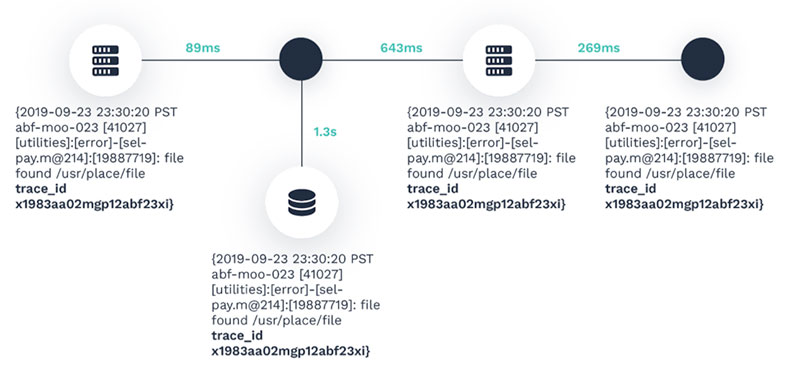
When requests are made to your gateway service, a trace ID is auto-generated and assigned to the request. This, of course, is written to the logs of your gateway service. As you’re developing a new service or enhancing an existing one, you add the logging framework to the service. This way, the service will pick up the original trace ID the gateway service added. Thus, you’ll add the same trace ID to the log events each corresponding service generates, as they are part of the originating request. The downside with this approach is that if you forget to add or alter the logging framework to the service, you’re left blind to traces with said service, so don’t forget.
At this point, remember that the first approach to understanding the value in your logs begins with a combination of two techniques involving semantic syntax and neural network processing. Once we’ve isolated the natural language, we begin to structure it both as surface structure and deep structure in the neural network. By determining the surface and deep structure of the event, we can begin to correlate and discover commonalities in the tokens and strings. This allows us to structure the tokens into deduplication keys so we can aggregate and consolidate the duplicate events into a single unique event while persisting the metadata to memory so we understand when and if there’s a deviation that would result in an updated event or a new unique event.
Since we have persisted the metadata to memory, to understand when and if there’s an updated event or a new unique event, we synchronously begin analyzing events with other events for commonalities. A commonality in the tokens and strings across the logs is the trace ID you’ve added. The vast majority of the log events would be noise, but the ones related to an important event would be associated and nested for an end-to-end view of the path along with the associated information in the log events.
Lastly, with this approach, since it’s directly associated with log events, and we have time-series analysis covered, and log messages always begin with a timestamp (hello, time-series), we employ our time-series metric analysis methods to build an availability percentage model. This way, not only do we record the source to destination (or end-to-end path), but also the time each request and response took in comparison with the predicted time they should have taken. Any time outside the expected time would generate and directly associate an anomaly.

Visualizing the connections based on the trace id from the logs
Method III
A significantly deeper approach to tracing has emerged in recent years with microservice architectures becoming the norm. Projects like OpenTracing, which has combined with OpenCensus to form OpenTelementry, describes a fundamental approach that allows you, as a developer, to add instrumentation directly to your application code using APIs. Code within your application will allow you to describe distributed transactions, semantics, and timing. Use a general-purpose distributed context propagation framework, to pass, encode and decode, metadata context in-process. This allows transmitting the metadata context over the network for IPC, and, tracking of parent-child, forks, and joins. This is key because it will also allow you to configure the output to the Moogsoft Collector, which will perform as your source and sink connector. And remember, there’s built-in intelligence!
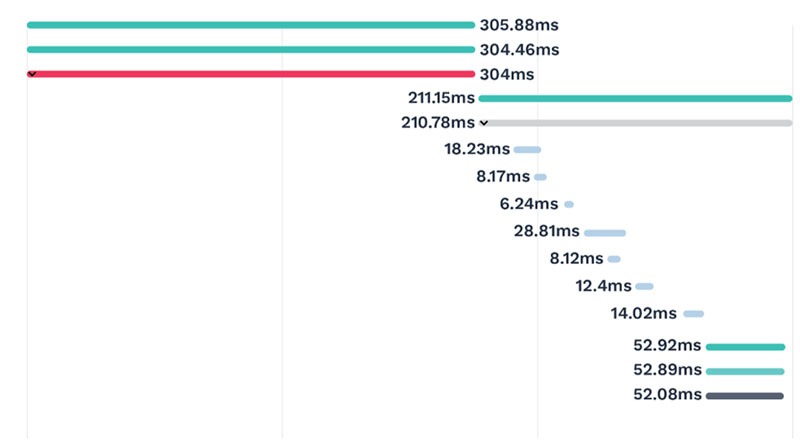
The Collector will intercept each IPC and naturally each span: The “span” represents a single unit of work completed within a distributed system. A new trace will begin every time a new span is created, as long as the span doesn’t have any references to a parent span, hence a new trace and not an existing one. This is how we build out a visual path and associate anomalies and context from logs.
Depending on the complexity and size of your application, some traces can be a mile long. Being able to nest requests and responses, and to aggregate transaction times is fundamental to properly visualizing and pinpointing issues. For example, there are multiple calls that your browser will make, those calls may take a different path from your mobile device, then there are calls within your application, and most likely there will be calls from your application to shared or external services. Being able to visually nest the browser, mobile device, application, and shared or external services, allows you to narrow down the issue to a specific area, or component within your application.

The end-to-end trace with each individual Span
Traces come third but might just end up your first
I’ve talked about the power of the Moogsoft Collector and the built-in intelligence: distributing AIOps throughout observability to the edge! The primary use case was time-series data collection and analysis for metric anomaly detection. But the possibilities quickly stacked up. There is so much time-series data associated with logs and tracing as well. When building out your observability and service assurance strategy, it’s imperative you leverage AIOps and start with metrics.
Metrics will tell you something is wrong before your application logs will. Your logs will provide vital context but only when AIOps is applied will you obtain the true value. Lastly, tracing. The combined methods of metrics and logs with the new approaches for distributed tracing unveils the true unforeseen value in tracing. So, tracing will be the third of the three pillars you tackle, but it will quickly become your go-to when issues are occurring.
Now that we’ve covered how AIOps boosts the three pillars of observability, we’ll wrap up this series with a post about monitoring, a vital but often overlooked element of observability. Look out for that post, which will explain why monitoring and observability go hand-in-hand and how AIOps unleashes their potential.
See the other posts to date in the series here:


