Introduction
There’s a number of monitoring and observability solutions on the market today. It almost reminds me of the automobile market and the endless number of automobiles available. Sure, they all get you from point A to point B, in some way. But some automobiles do it faster, smoother, more efficiently, with guidance, more comfort, storage space, perhaps towing capability, and even autonomously. Moogsoft is the automobile you’ve been dreaming about in the monitoring and observability market. The one with the speed and scalability, the comfort and smoothness, the autonomous intelligence, and the guidance from the flexible and transparent configuration. Guidance and transparency that start right at the beginning of your journey: collecting and integrating your data!
New Features & Enhancements
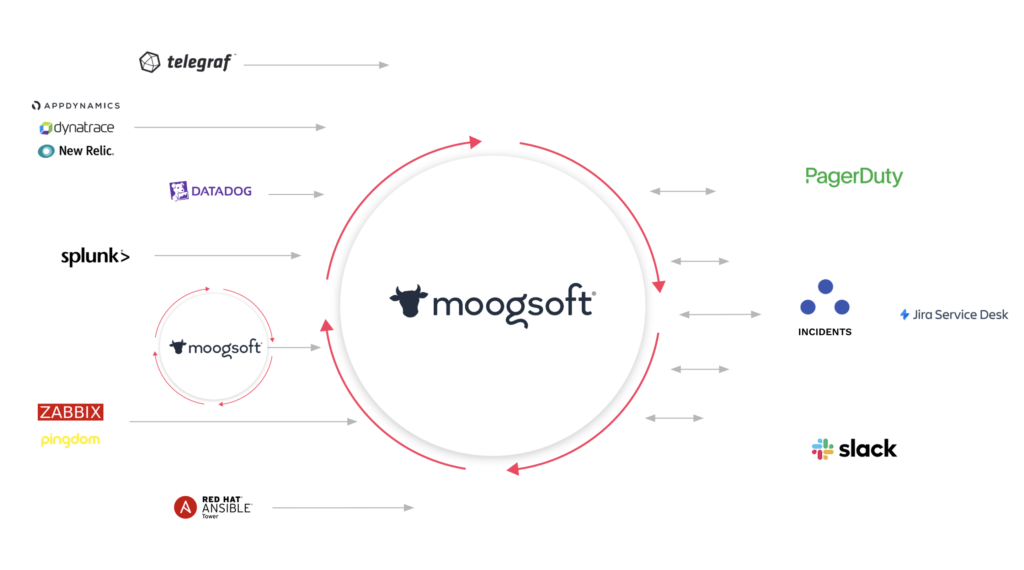
Reduce false positives and increase the context of your incidents by easily integrating all your telemetry data using flexible, transparent, and preconfigured integrations. API endpoints are automatically generated along with the API key to authenticate. The same goes for the data mapping and deduplication keys, they are configured automatically too. With a few simple clicks, you’ll have your data collected, integrated, and normalized with the transparency and flexibility you need to adjust any configuration at any time. Metric data, log data, change data, event data… we’ve got you covered!

Telegraf
Goodbye, static threshold rules generating alerts to send to your notification system, and hello, automated anomaly detection. Save time and effort to focus on what matters most in your day.
The Telegraf endpoint is a dedicated endpoint that supports the Telegraf format. You can send your Telegraf and InfluxDB data to the endpoint for visualization, and anomaly detection.
There’s a lot of value in the metric data you are collecting. But, it can be hard to find meaningful data in your collection. Multiple charts, graphs, and queries just won’t save you time and present the actionable data when you need it most.
Send your Telegraf and InfluxDB data to the dedicated Telegraf endpoint for automatic and adaptive thresholds that will generate anomalies, perform deduplication and alert correlation for you.
Splunk
Stop writing query after query, search after search, and sifting through terabytes of event data to understand which events are related, important, or need your attention.
With the Splunk add-on, you have the choice to easily stream all the events you care about from a given search or send the individual alerts that have been pre-configured with business logic. Proxy in the way, no worries, the Moogsoft Splunk add-on has that configuration covered for you.
By sending your Splunk events to Moogsoft you get the power of correlation, workflow automation, and incident context so you can make sense of your data and resolve issues faster.
AppDynamics, Dynatrace, New Relic
The age-old saying “when something goes wrong, everything goes wrong” holds a lot of truth when it comes to application failures. Don’t let a narrow view get in the way of fixing issues faster. When your application experiences performance issues, or is completely unavailable, your user experience is directly impacted. This is not good. Application Performance Management (APM) tools like AppDynamics, Dynatrace, and New Relic, provide performance alerts that allow you to react when issues occur. But what about all the surrounding applications and infrastructure that your application relies on?
Context is the most important thing when it comes to understanding what went wrong, why it went wrong, and how to prevent it from going wrong again, not to mention when you’re building in reliability, to begin with. As you are well aware, applications in today’s world are very complex, so, reacting when issues occur is particularly important in the highly distributed, multi-cloud, ephemeral world that has been created. You need the context so you can react on time to restore your application to normal performance.
With the recent integration updates for AppDynamics, Dynatrace, and New Relic, you can easily bring your APM alerts together with other application and infrastructure alerts in Moogsoft. While leveraging the important business metrics you need to align your team to focus on prioritizing what’s important and remediations that directly impact your business.
Zabbix, Pingdom
Networks, Servers, VMs, Clouds, and websites are all components your applications and services rely on. Don’t get caught scratching your head when issues occur by focusing on one single area that might not be the cause.
Understanding when there’s an issue with your infrastructure, and arguably even better, when there’s a performance or availability issue with your website, is a no-brainer. This is why we’ve updated the Zabbix and Pingdom integration to make ingesting the alerts into Moogsoft even easier and the configuration completely transparent.
When you integrate Zabbix and Pingdom with Moogsoft you’ll have the context you need to understand what’s affecting your website performance and availability, you’ll know when Zabbix is reporting an alert or a deeper problem. Zabbix and Pingdom alerts are correlated with anomalies and alerts from other monitoring tools. This allows you to focus and fix issues faster so you maintain your SLA’s and customer experience.
Ansible Tower
Are you still trying to figure out why things aren’t working to only discover too late that an automation job failed?
The Ansible Tower integration in Moogsoft gives you the flexibility and ease to ingest your Ansible jobs. Need to understand the start, success, and failures? No problem, the flexibility of the integration is in your hands to ingest what you need. By default, job failures are ingested.
When you send your Ansible job failures to Moogsoft you get the missing context of failed changes in your environment, so you can restore the service and investigate why the job failed so it doesn’t happen again.
Moogsoft in the News
Check out the recap for September:
Moogsoft Steals the Spotlight in GigaOm Radar Report
Digital Architects Zurich Partners with Moogsoft to Limit Developer Interruptions
Upcoming Events
We look forward to seeing you at these upcoming webinars and virtual events.
Moog 101 (Product Demo Series) — October 20
DASH CON — October 26-27
The Road Ahead
Here we are in the final quarter of 2021 and what a year it has been so far. But we’re certainly not done yet. We’ve got a ton of goodness around the corner to close out this year, so stay tuned to your monthly moo for more updates.
Updates based on our meticulous attention to user experience, our passion for our customers, and our vision to bring continuous service assurance to the software-defined world help us shape the future of Observability with AIOps as we deliver the features and functionality needed!
Stay tuned for updates:
- Who doesn’t love a good dashboard?!
- SSO configuration for Okta via OIDC
- Search & Filter enhancements
- Some major Webhook enhancements


